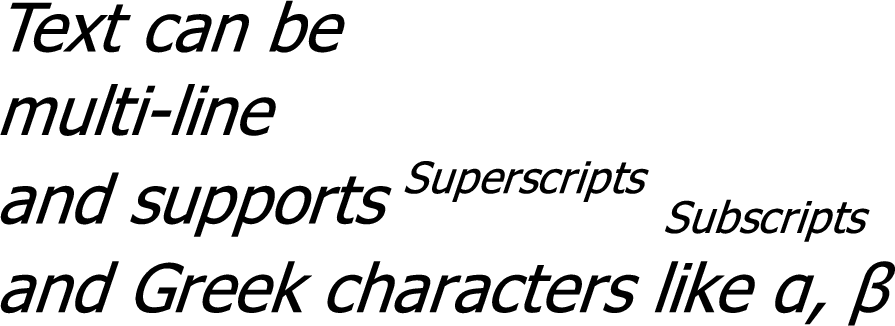
The note widget places the text line ``Enter your note here'' on the canvas.

Double-clicking on the text, or choosing Description from the context menu, brings up the note form:
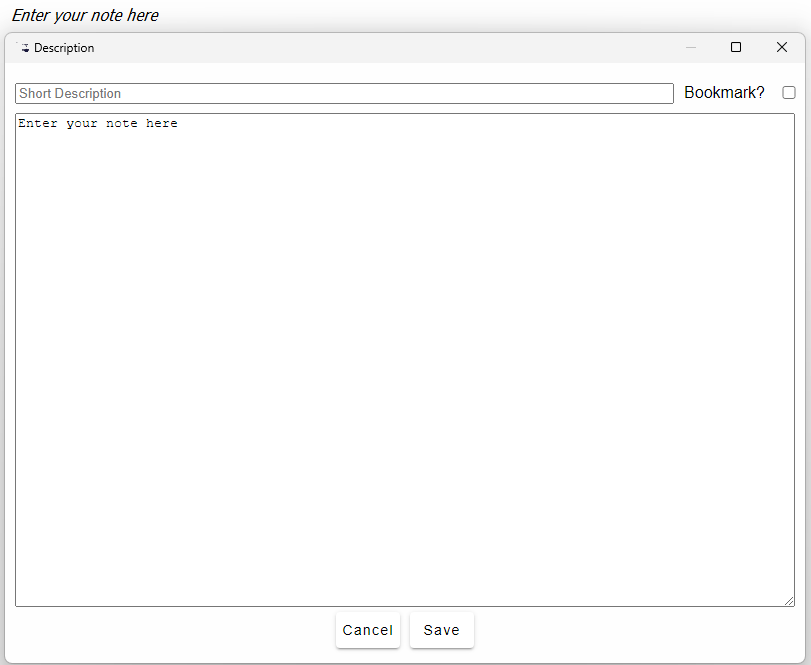
The Short Description field becomes a tool-tip for this note, and also doubles as a Bookmark should you check the Bookmark? box.
Notes allow arbitrary text to be placed on the canvas for explanatory purposes. Anything that can be entered on the keyboard can be placed here, including Unicode characters, and LATEX formatting is supported.