Plot widget

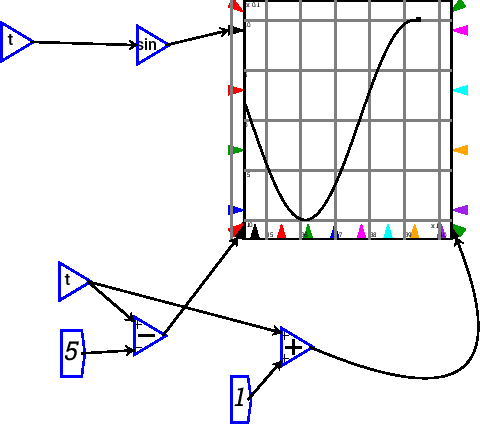
A plot widget embeds a dynamic plot into the canvas. Around the outside of the plot are a number of input ports that can be wired.

\includegraphics{images/plotWidget.eps}

left hand edge
Up to 4 quantities can be plotted on the graph simultaneously, with line colour given by the colour of the input port
right hand edge
Another 4 quantities can be added to the plot. These are shown on a different scale to the left hand inputs, allowing very different magnitudes to be compared on the one plot.
bottom edge
Quantities controlling the $x$-coordinates of the curves. The colours match up with the colour of the pen being controlled.

\includegraphics{images/plotLissajous.eps}

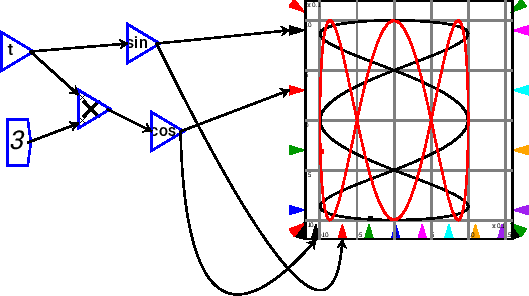
If only one bottom port is connected, then that controls all pens simultaneously, and if no ports are connected, then the simulation time is used to provide the $x$ coordinates

corners
Corner ports control the scale. You can wire up variables controlling minimum and maximum of the $x$, $y$ and right hand $y$ axes. If left unwired, the scales are determined automatically from the data. This can be used, for example, to implement a sliding window graph

\includegraphics{images/plotSlidingWindow.eps}