plots.tcl File Reference
Go to the source code of this file.
Functions | |
| deiconifyPltWindowOptions | |
| setPlotOptions plot | |
| doPlotOptions plot | |
| plotDoubleClick plotId | |
| hex x | |
| colourName x | |
| configColourButton b | |
| makeRow i p | |
| penStyles plot | |
| penStyleOK plot | |
| addRow plot | |
Function Documentation
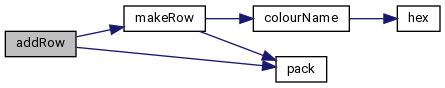
◆ addRow()
| addRow | plot | ||
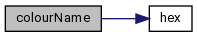
◆ colourName()
| colourName | x | ||
◆ configColourButton()
| configColourButton | b | ||
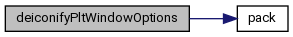
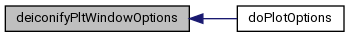
◆ deiconifyPltWindowOptions()
| deiconifyPltWindowOptions |
Definition at line 21 of file plots.tcl.
References pack().
Referenced by doPlotOptions().
47 ttk::combobox .pltWindowOptions.plotType.val -width 20 -state readonly -textvariable plotWindowOptions(plotType) -value {line bar automatic}
54 checkbutton .pltWindowOptions.options.subgrid -text "Subgrid" -variable plotWindowOptions(subgrid)
56 pack .pltWindowOptions.options.grid .pltWindowOptions.options.subgrid .pltWindowOptions.options.legend -side left
83 pack .pltWindowOptions.title .pltWindowOptions.xaxislabel .pltWindowOptions.yaxislabel .pltWindowOptions.y1axislabel .pltWindowOptions.plotType
94 pack .pltWindowOptions.xticks .pltWindowOptions.yticks .pltWindowOptions.options .pltWindowOptions.logscale
Here is the call graph for this function:
Here is the caller graph for this function:
◆ doPlotOptions()
| doPlotOptions | plot | ||
Definition at line 127 of file plots.tcl.
References deiconifyPltWindowOptions().
Here is the call graph for this function:

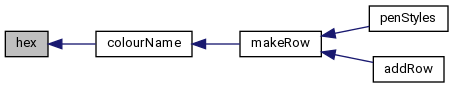
◆ hex()
| hex | x | ||
Definition at line 176 of file plots.tcl.
Referenced by colourName().
Here is the caller graph for this function:
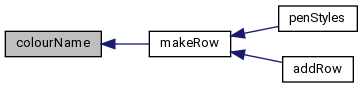
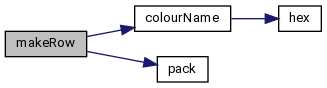
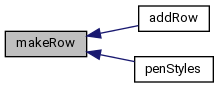
◆ makeRow()
| makeRow | i p | ||
Definition at line 189 of file plots.tcl.
References colourName(), and pack().
Referenced by addRow(), and penStyles().
192 button .penStyles.row$i.colour -background [colourName $p.colour] -command "configColourButton .penStyles.row$i.colour"
195 ttk::combobox .penStyles.row$i.style -width 10 -state readonly -values {"————" "- - -" "· · ·" "- · -"}
196 pack .penStyles.row$i.no .penStyles.row$i.colour .penStyles.row$i.width .penStyles.row$i.style -side left
Here is the call graph for this function:
Here is the caller graph for this function:
◆ penStyleOK()
◆ penStyles()
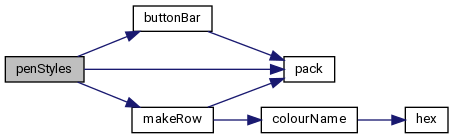
| penStyles | plot | ||
Definition at line 199 of file plots.tcl.
References buttonBar(), makeRow(), and pack().
Here is the call graph for this function:
◆ plotDoubleClick()
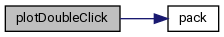
| plotDoubleClick | plotId | ||
Definition at line 160 of file plots.tcl.
References pack().
Referenced by editItem().
Here is the call graph for this function:
Here is the caller graph for this function: